
Sample report
A real roof, measured from aerial LiDAR
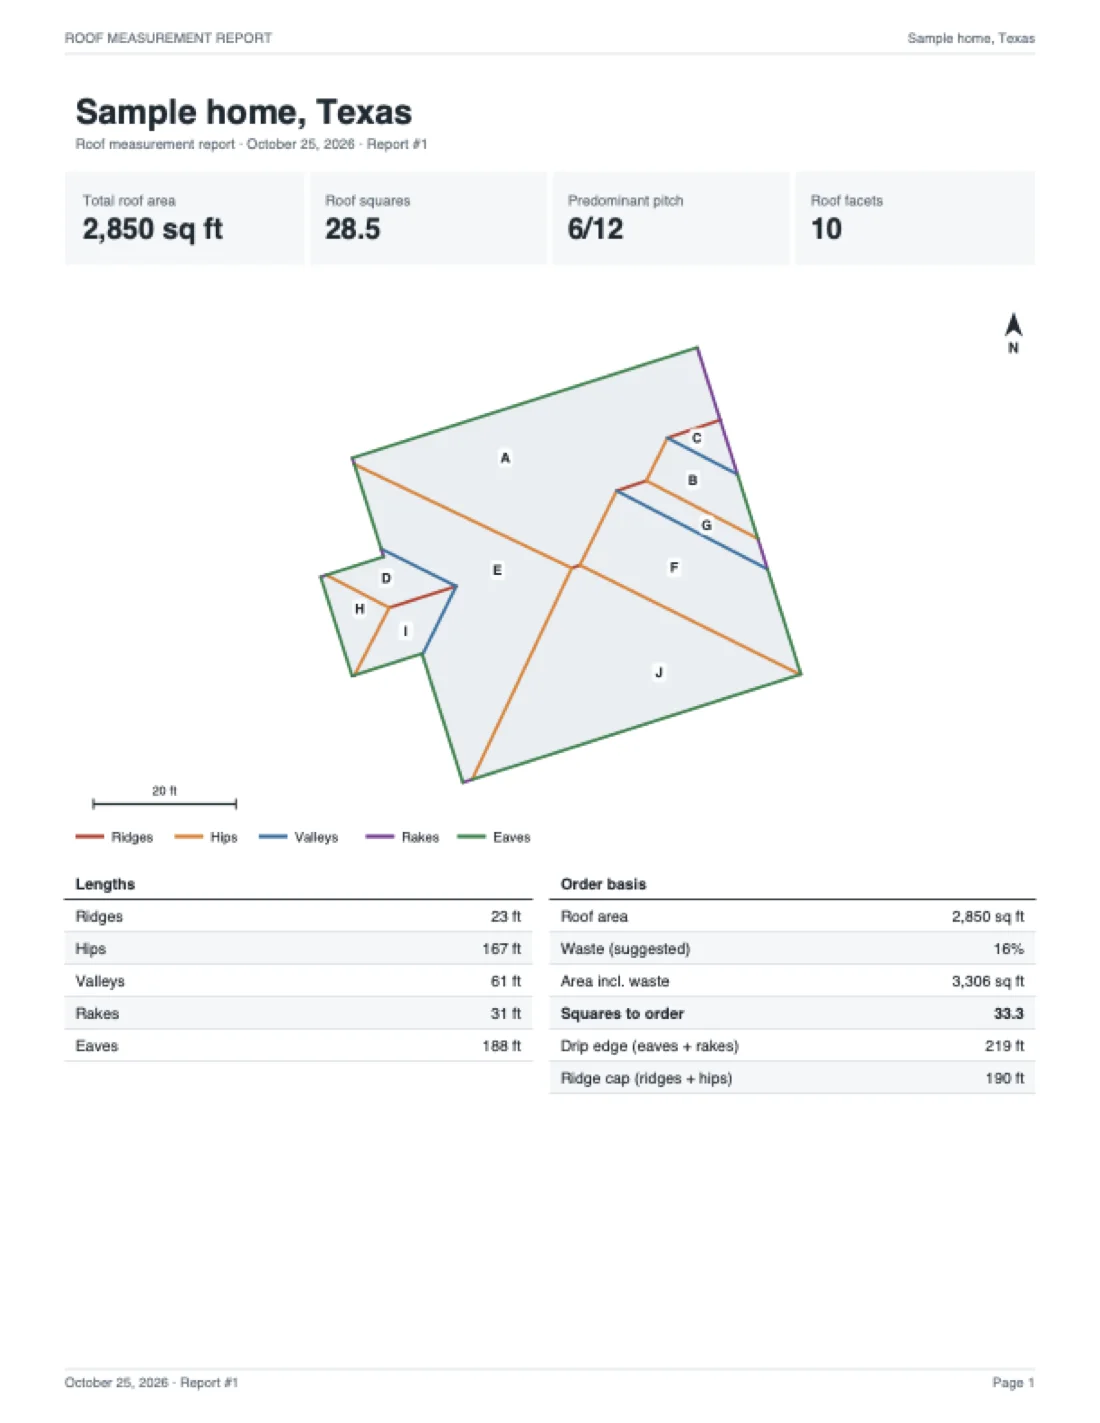
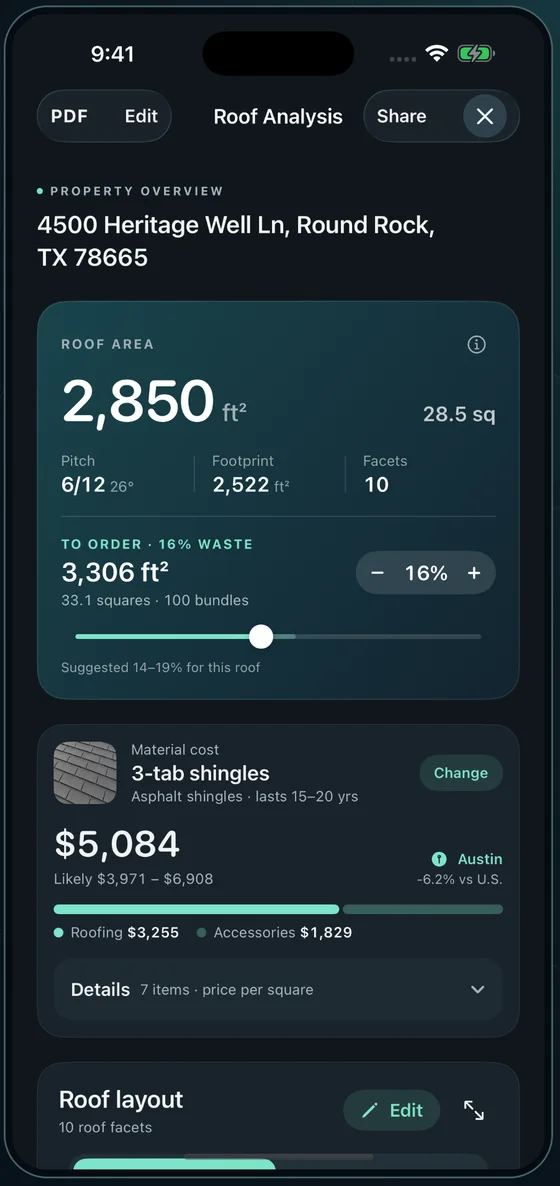
This is the report Roofari built for a hip roof in Round Rock, Texas — every facet reconstructed in 3D from USGS 3DEP LiDAR (2019). The numbers below are the real ones from that roof.
Roof area2,850 sq ft
Squares28.5
Predominant pitch6/1226.5°
Facets10
Footprint2,522 sq ft
Edge lengths
| Edge | Length | Orders |
|---|---|---|
| Hips | 167 ft | Hip & ridge cap |
| Ridges | 23 ft | Hip & ridge cap |
| Valleys | 61 ft | Valley lining |
| Eaves | 188 ft | Starter, drip edge |
| Rakes | 31 ft | Starter, drip edge |
Facets
| Facet | Area | Pitch |
|---|---|---|
| A | 794 sq ft | 6/12 |
| B | 662 sq ft | 6/12 |
| C | 579 sq ft | 6/12 |
| D | 371 sq ft | 6/12 |
| E | 107 sq ft | 6/12 |
| F | 84 sq ft | 6/12 |
| G | 73 sq ft | 6/12 |
| H | 77 sq ft | 6/12 |
| I | 69 sq ft | 6/12 |
| J | 35 sq ft | 6/12 |
What is in a full report
- Measurements: total roof area along the slope, squares, predominant pitch, footprint, every facet’s area and pitch.
- Edges: ridges, hips, valleys, eaves and rakes in linear feet, drawn on a length diagram.
- Order basis: a suggested waste range from the roof’s own hips and valleys, squares to order, drip edge and cap lengths.
- Materials: quantities and typical material cost for the chosen shingle, metal or membrane, by state.
- 3D model you can rotate, and a quality section that says which parts the survey supports — and which it does not.
- Source: the survey and its year, so you know how current the data is.
Reports are preliminary estimates from aerial survey data, not an on-site measurement. Confirm before ordering. Data sources & accuracy.